Each certification reflects a step in mastering real-world analytics tools and methodologies.
Less Talk, More Data
“Without data, you're just another person with an opinion.” – W. Edwards Deming
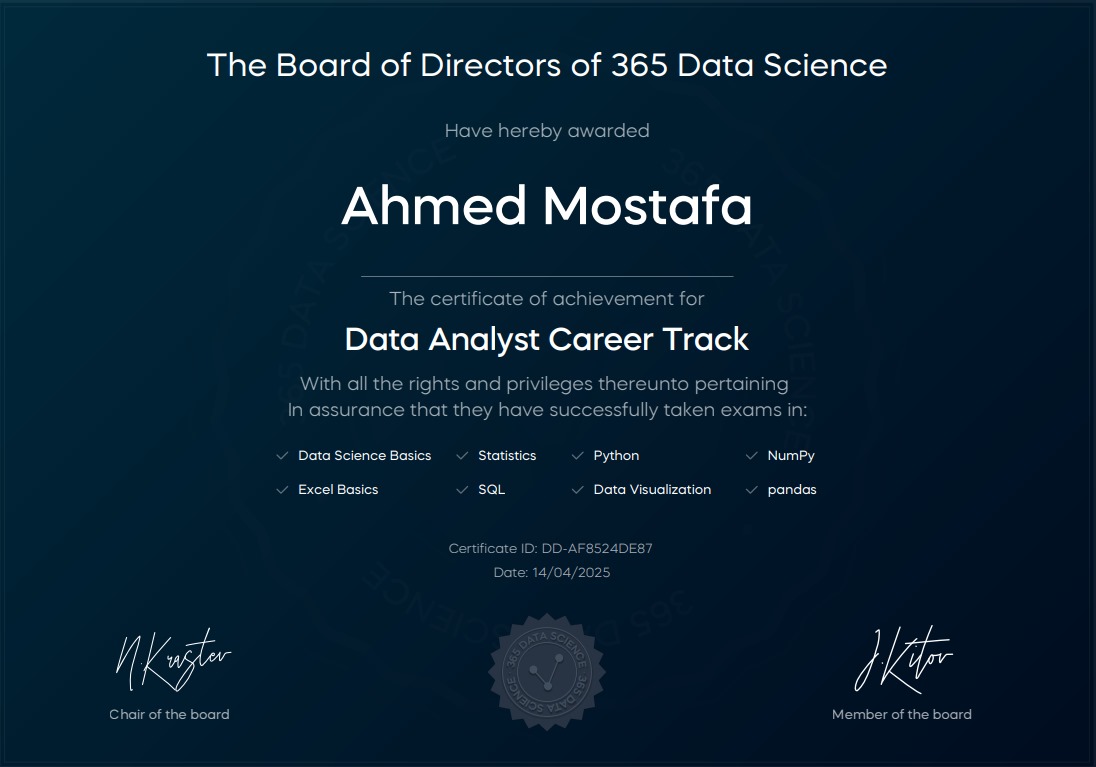
Data Analyst Career Track – 365 Data Science
- Gained hands-on experience with Excel, SQL, Python, Tableau, and data visualization techniques
- Developed practical skills in data wrangling, statistical analysis, and business-focused insights
- Completed project-based modules using real-world datasets to solve analytical challenges
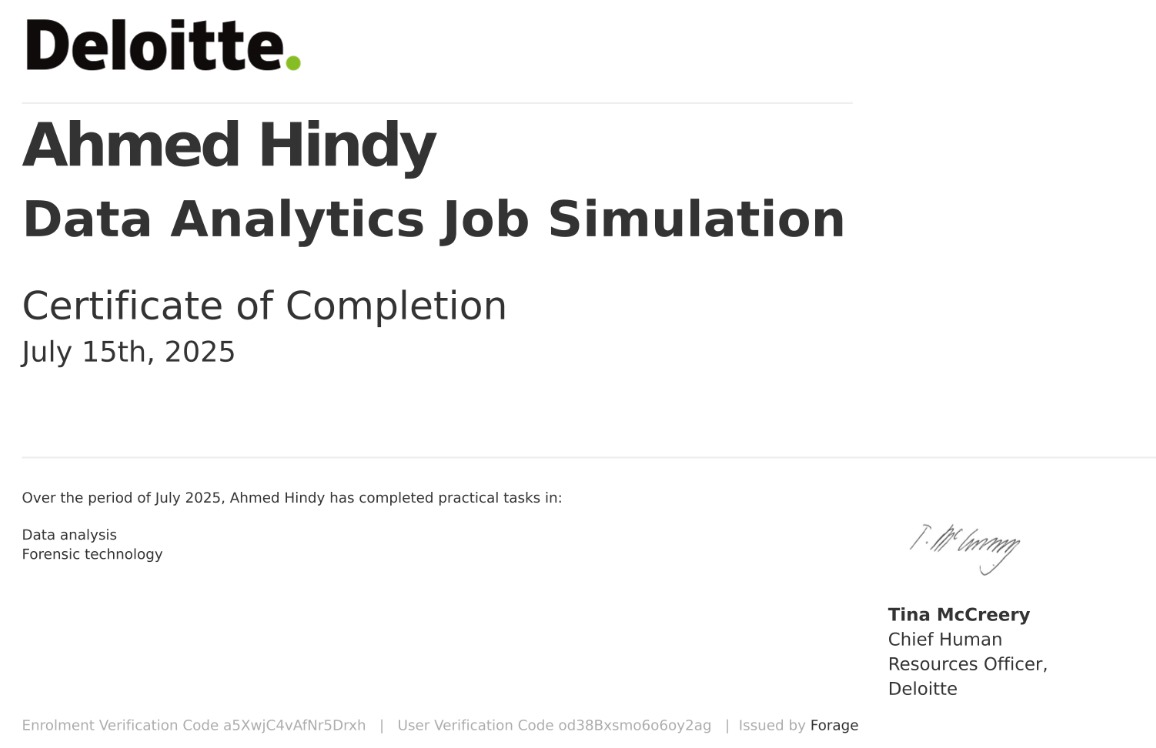
Deloitte Australia Data Analytics Virtual Internship
- Tackled a real-world Deloitte data analysis and forensic technology task
- Built an interactive dashboard using Tableau
- Applied Excel to classify financial data and derive meaningful business insights
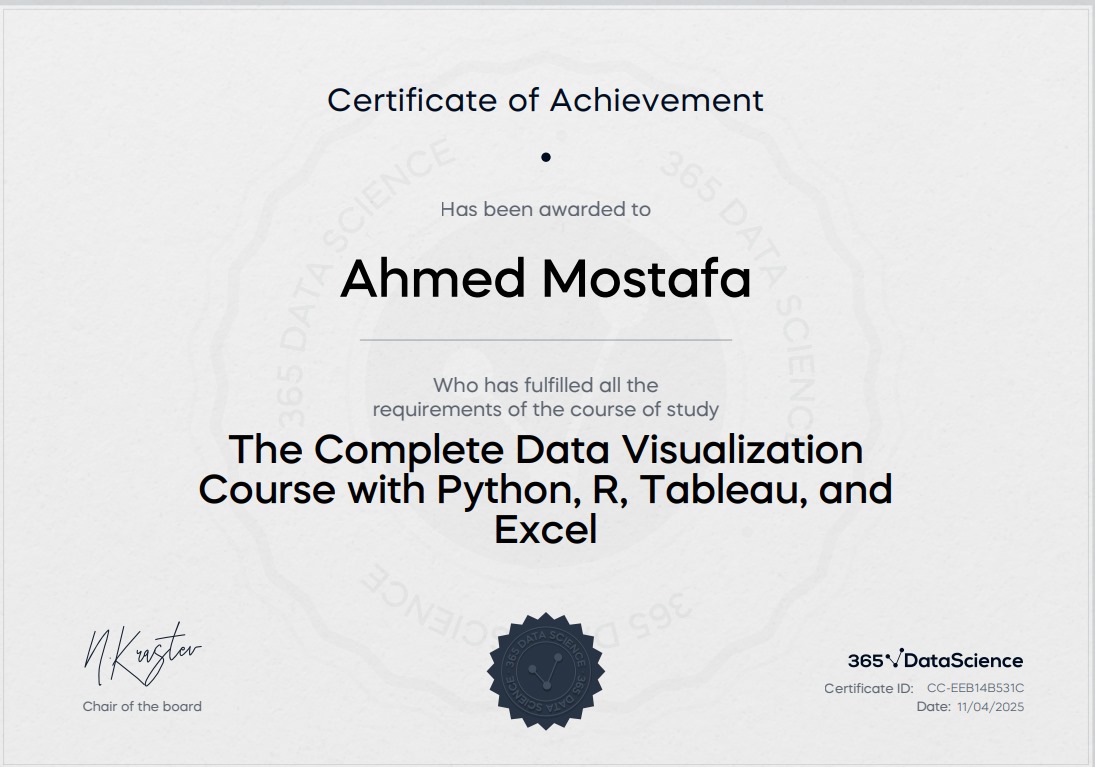
Data Visualization with Python, R, Tableau & Excel
- Built data visualizations using Python (Matplotlib, Seaborn), R (ggplot2), Tableau, and Excel
- Learned to choose appropriate chart types for different data and audience needs
- Developed interactive dashboards and visuals to communicate data-driven stories effectively
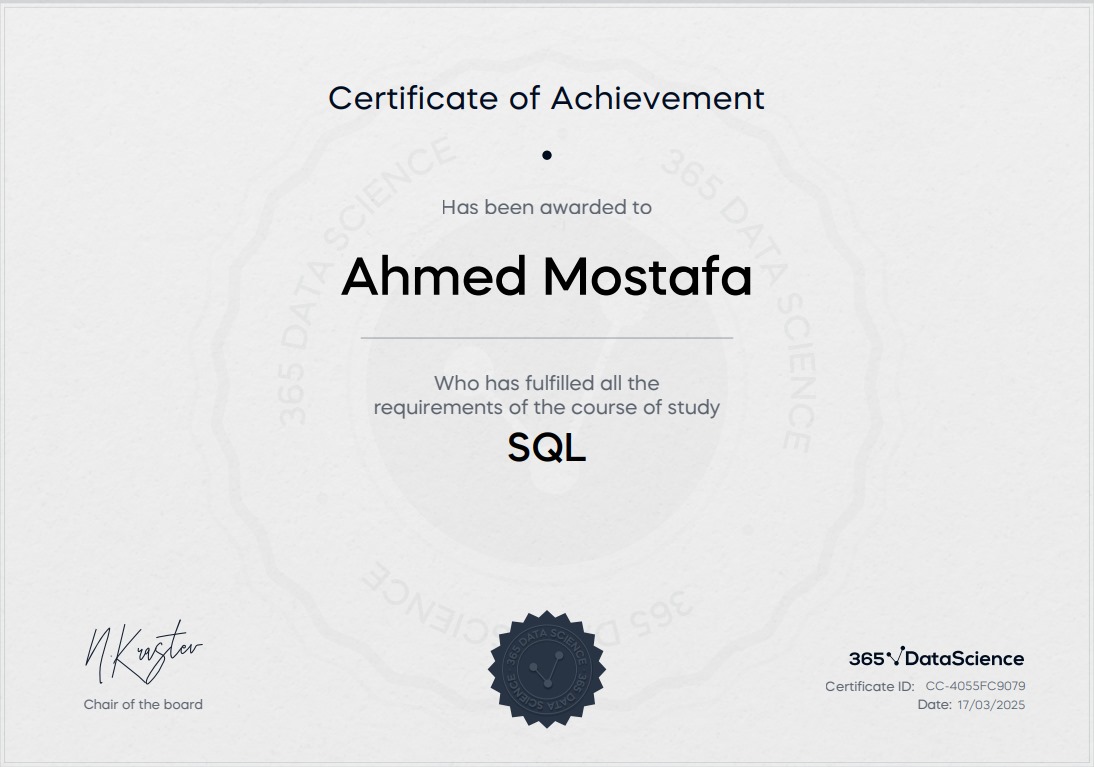
SQL Fundamentals Certificate
- Learned to write and optimize SQL queries for data extraction and analysis
- Gained hands-on experience with filtering, joins, aggregation, subqueries, and window functions
- Practiced building complex queries to solve real-world analytical problems with relational databases
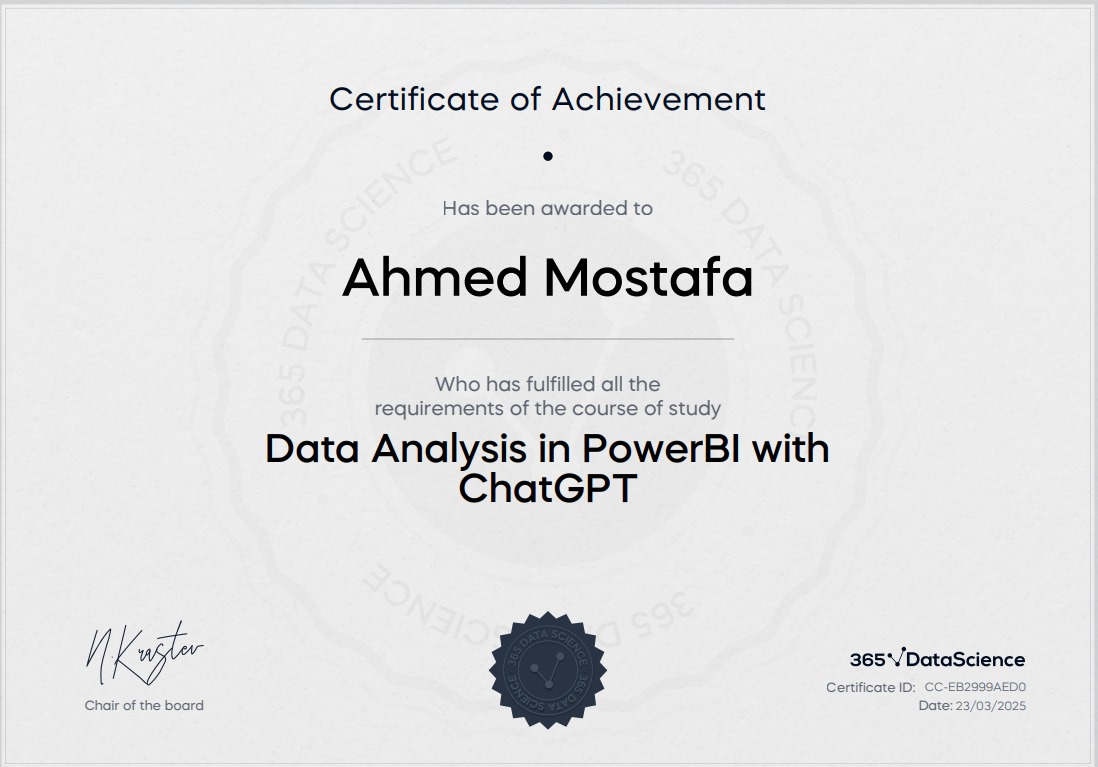
AI-Enhanced Data Analysis in Power BI
- Learned to build dynamic reports and dashboards in Power BI using real-world datasets
- Integrated ChatGPT to streamline DAX formulas, data insights, and report optimization
- Explored AI-assisted workflows to enhance data storytelling and decision-making
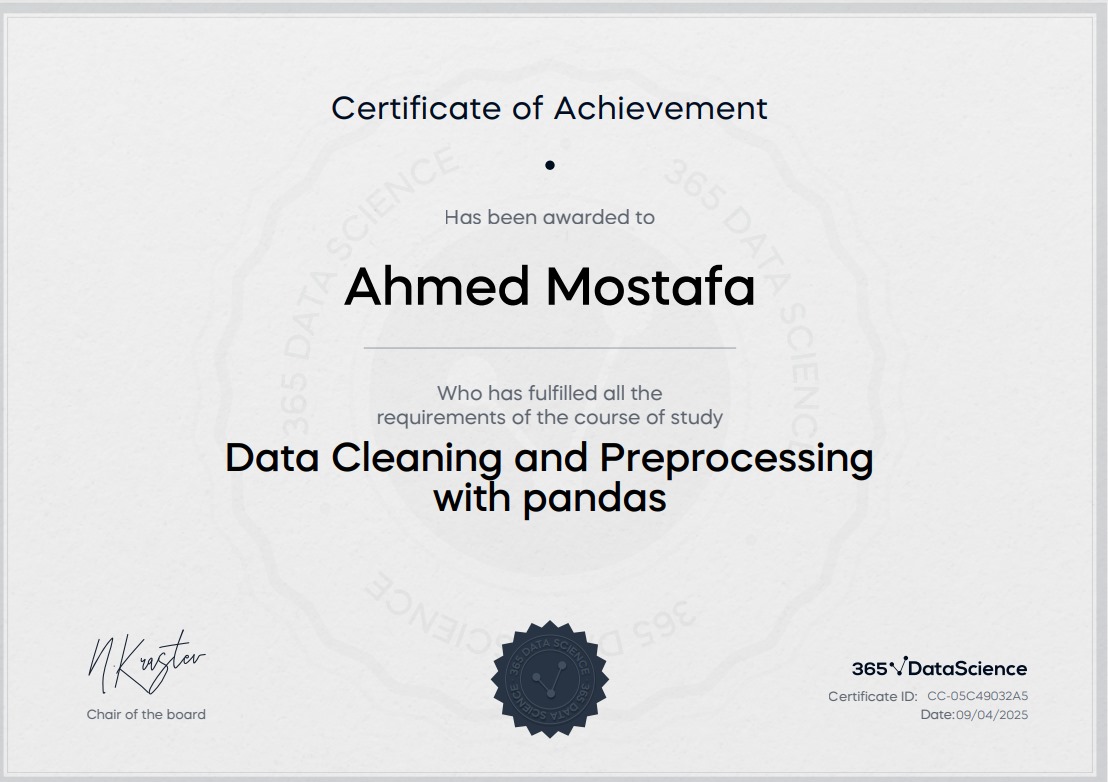
Data Preprocessing in Python with pandas
- Learned techniques for handling missing data, duplicates, and inconsistent formats in real datasets
- Applied pandas to reshape, filter, and transform data for analysis
- Gained practical experience preparing messy datasets for use in analytics projects
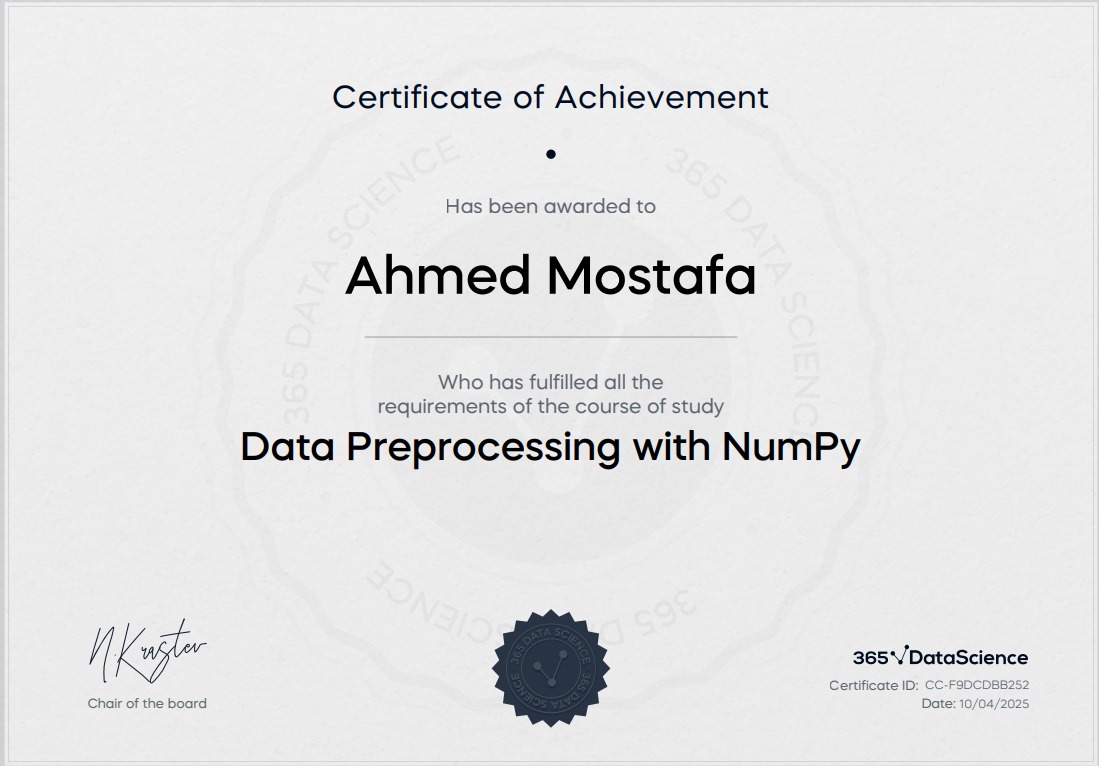
NumPy for Data Preparation
- Mastered array manipulation, indexing, and slicing using NumPy
- Applied vectorized operations for efficient data transformation and computation
- Gained practical skills in preparing structured data for analysis and modeling
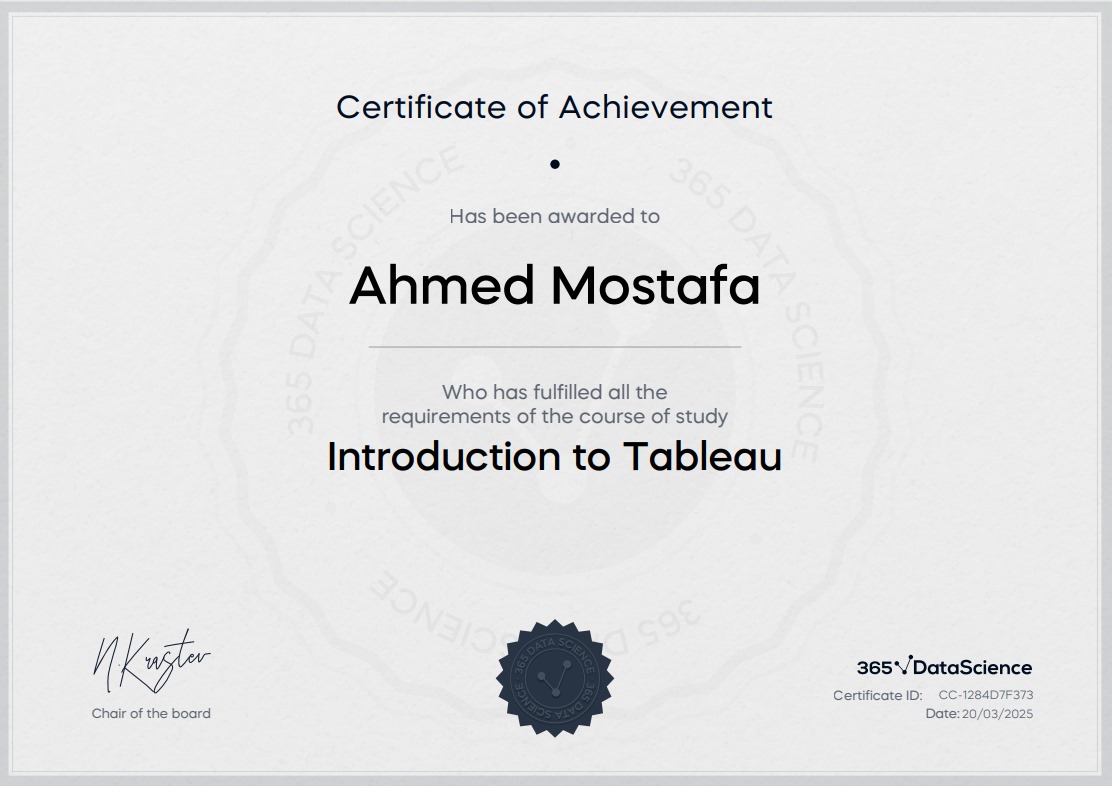
Tableau Basics for Analysts
- Learned the fundamentals of building interactive dashboards and visualizations in Tableau
- Gained experience connecting data sources, filtering data, and creating dynamic charts
- Explored best practices for effective data storytelling and dashboard design

Descriptive & Inferential Statistics
- Covered key statistical concepts including distributions, probability, hypothesis testing, and confidence intervals
- Learned to apply statistical reasoning in data interpretation and decision-making
- Gained hands-on practice using real datasets to analyze trends and variability
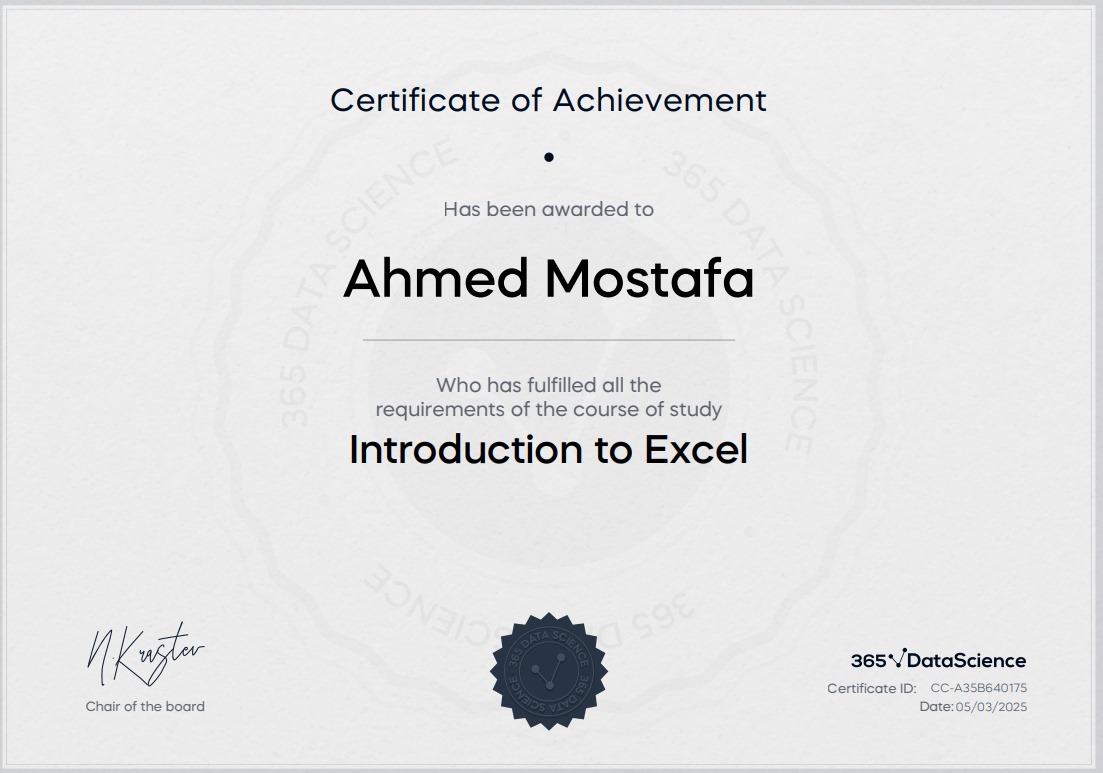
Excel for Data Analysis
- Learned foundational Excel functions for organizing, analyzing, and summarizing data
- Practiced working with formulas, cell referencing, sorting, and filtering large datasets
- Built a strong base in spreadsheet-based analysis used in real-world business scenarios
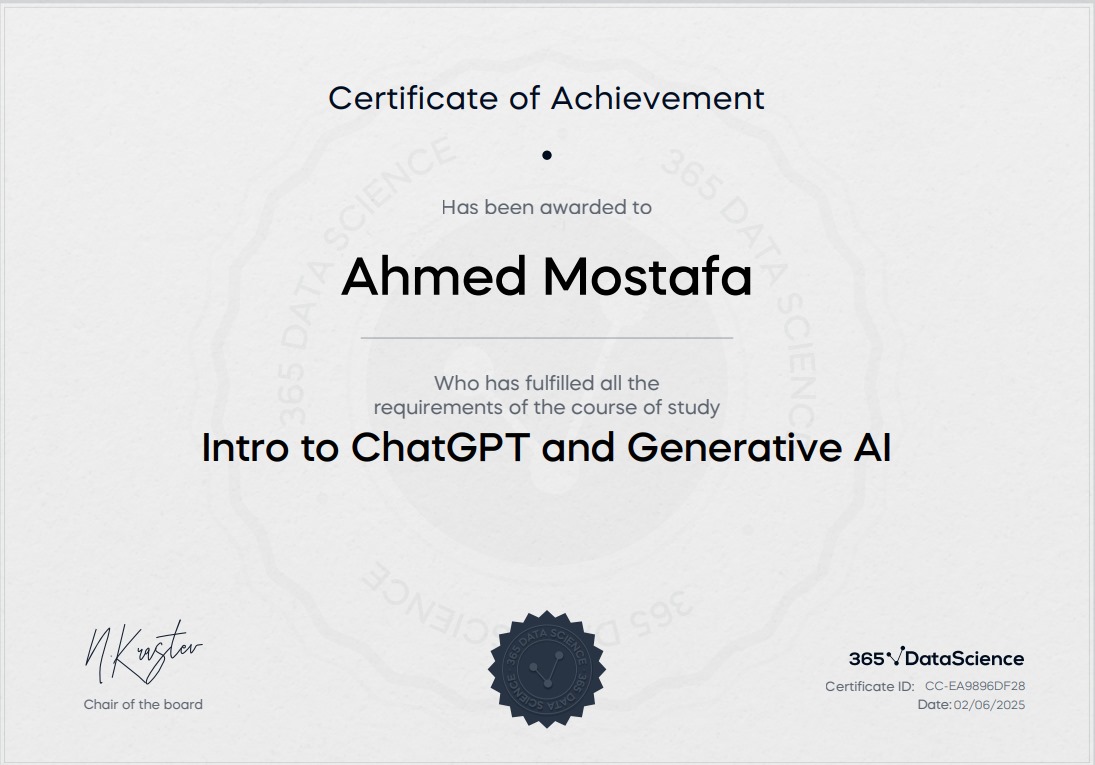
Foundations of Generative AI and ChatGPT
- Explored the principles behind ChatGPT and the broader field of generative AI
- Learned to use AI tools for content creation, automation, and data-related tasks
- Gained insight into ethical considerations, limitations, and use cases in data workflows
From Certificates to Real Work
Certifications are a start — but applying those skills is where it really counts. Click on the Projects button to explore the projects I’ve completed using these tools.
