
A showcase of my most creative and insightful data projects.
The Secret Sauce
It’s not the tools, but how you use them to solve problems.
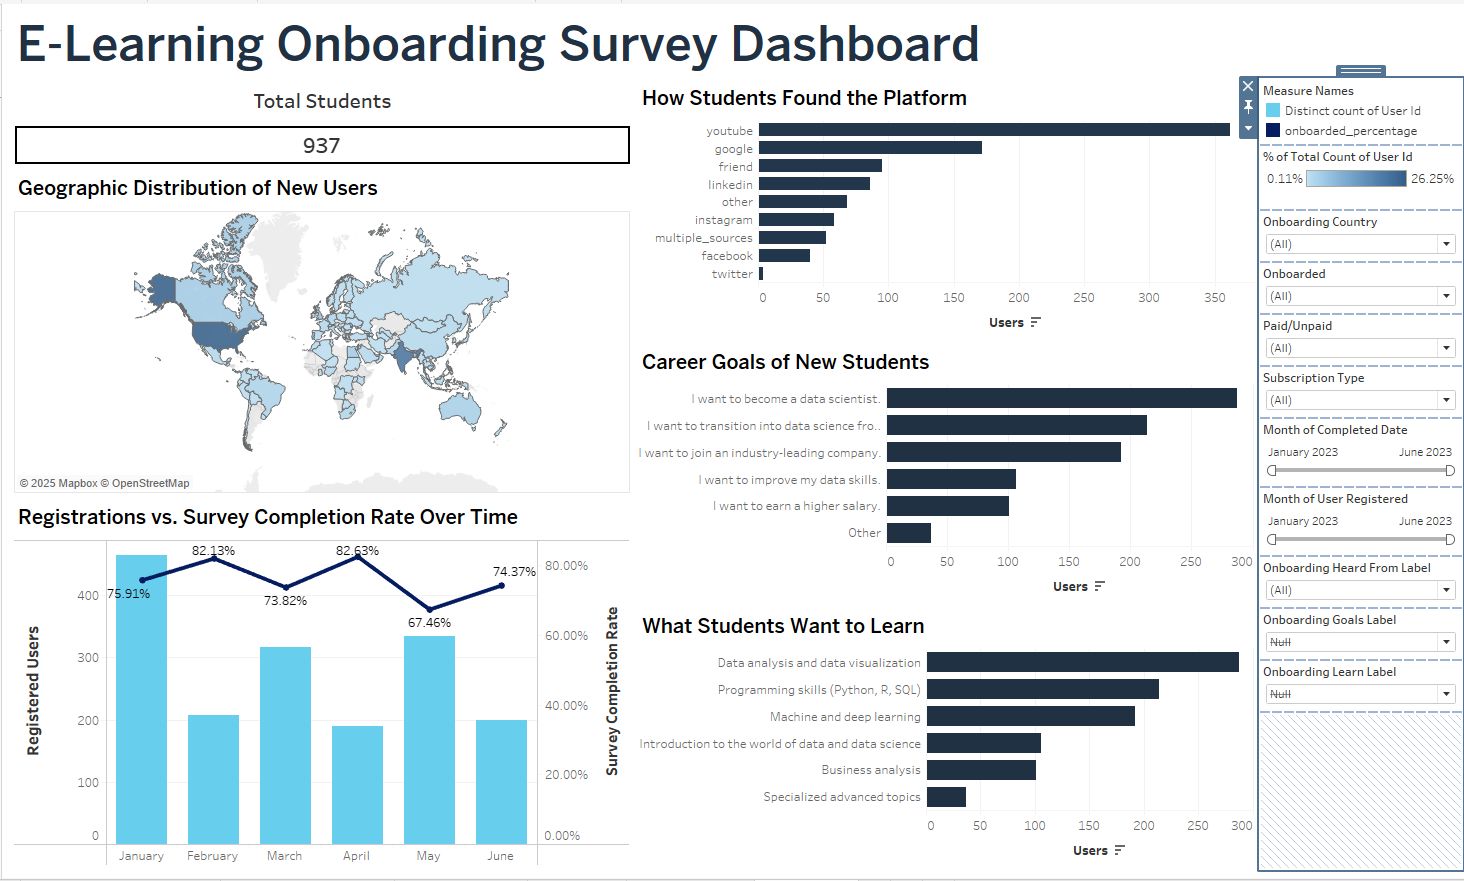
Inside Student Journeys: An Interactive Tableau Dashboard
- Transformed raw survey data into actionable, interactive charts.
- Uncovered main discovery channels (YouTube, Google) and most desirable skills (data analysis, visualization).
- Empowered stakeholders to filter by country, subscription, and more - guiding data-informed decisions.
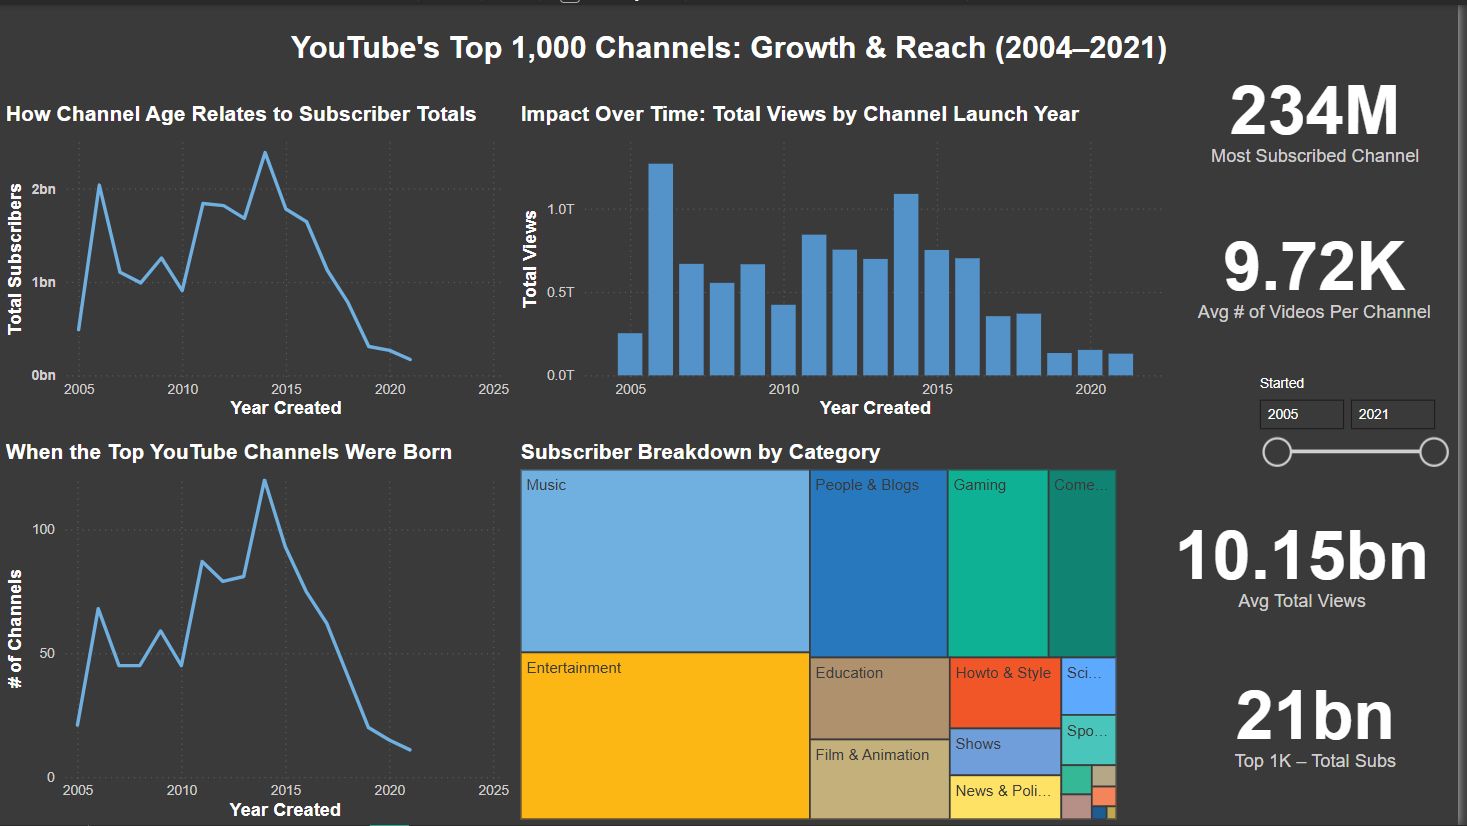
YouTube’s Top 1,000: A Power BI Analysis
- Built interactive Power BI dashboard to track YouTube’s top channels over time.
- Analyzed algorithm trends, retention, and globalization effects.
- Highlighted contrast between sustained dominance and explosive new growth.
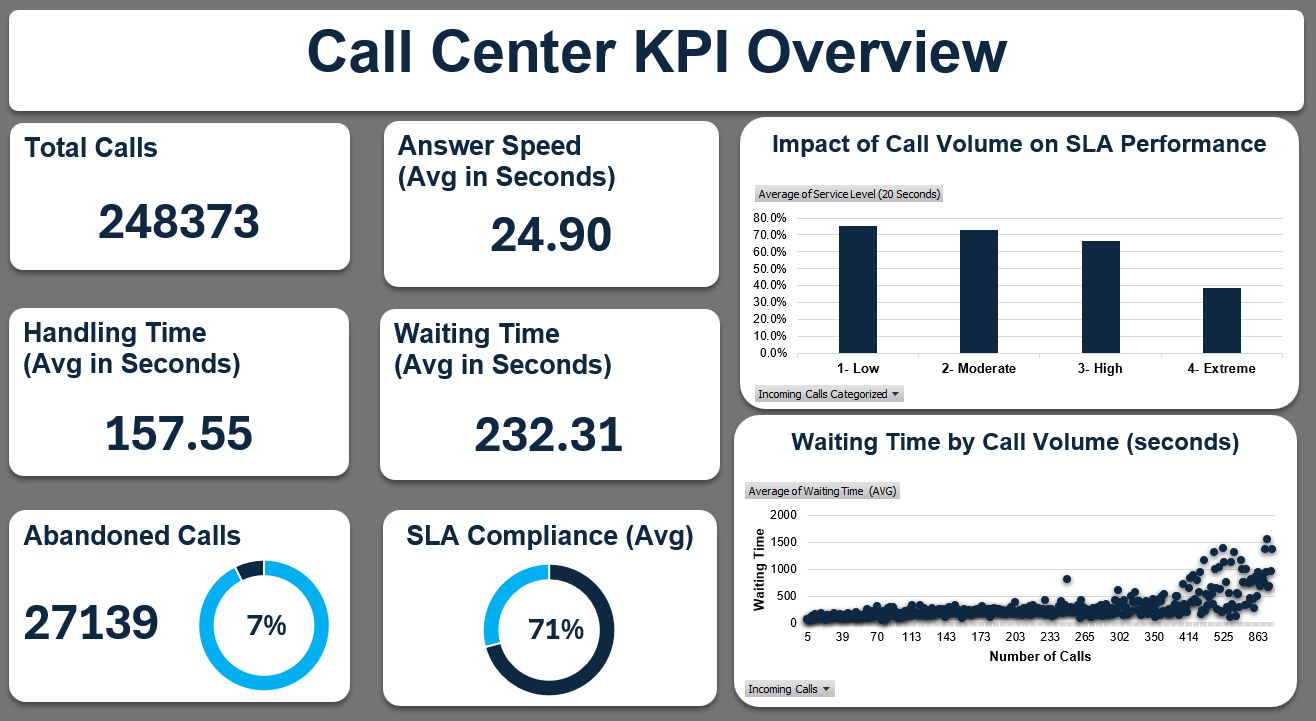
Call Center Performance Analysis (2019–2021) — Excel Dashboard
- Built an interactive Excel dashboard to track call center performance over 3 years.
- Analyzed the impact of call volume on service quality and SLA compliance.
- Highlighted capacity bottlenecks and actionable opportunities for operational improvement.

Amazon Product Scraper — Python
- Built a web scraper with Beautiful Soup and pandas to extract product titles and prices.
- Implemented periodic data collection to track price fluctuations over time.
- Cleaned and preprocessed the scraped data for further analysis and visualization.
Validation of My Expertise
Behind every project stands a strong foundation of training. View my certifications to see where I’m headed.