Call Center "Center of Excellence" Reporting Suite
A multi-tab Excel reporting suite that became the account's single source of truth. Each tab is a standalone report — audit attainment, coaching attainment, weekly quality, compliance, audit-over-audit consistency, and D-Sat bucketing — feeding the weekly business review.
What it does
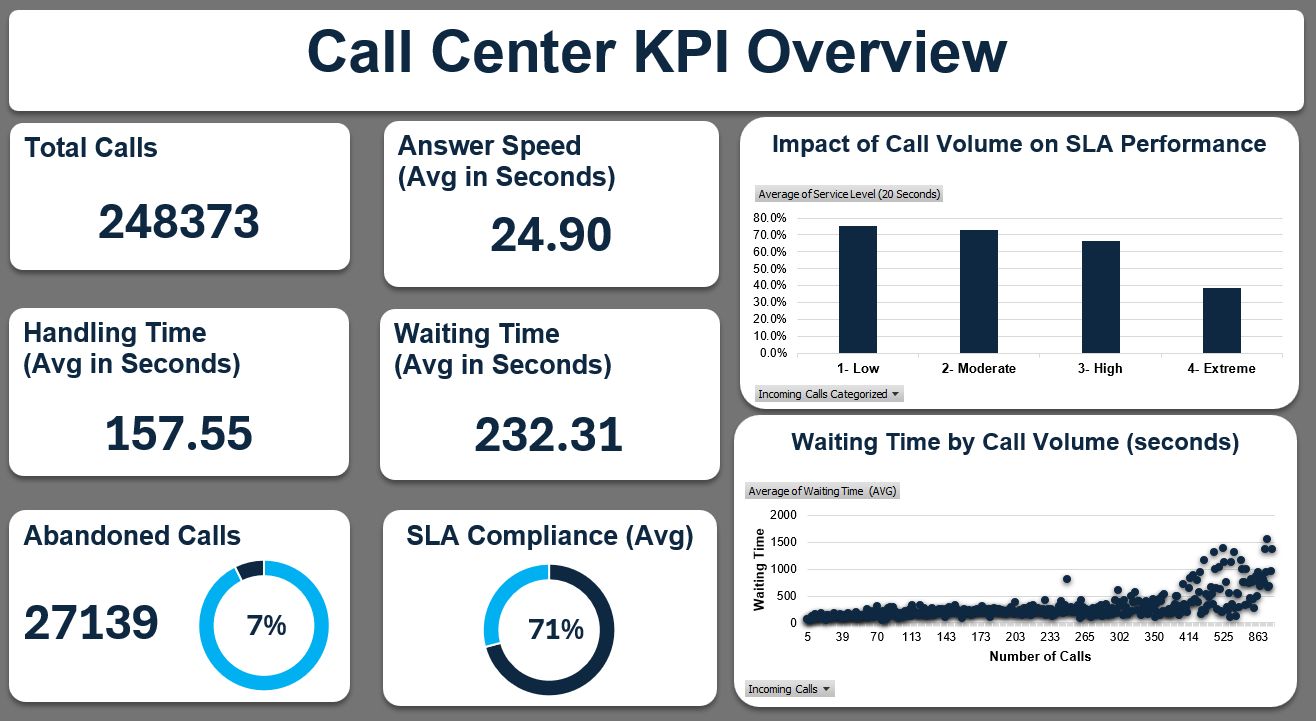
- Tracks three years of performance across roughly 250,000 calls in one governed workbook.
- Used by QA and operations leaders in weekly reviews to steer coaching and staffing.
- Automation cut reporting time by 60%, freeing analyst hours for deeper investigation.
Insight surfaced
- Analyzed how call volume affects service quality and SLA compliance.
- Revealed a 30% SLA drop during peak hours and pinpointed capacity bottlenecks.
- Turned findings into staffing and scheduling recommendations for leadership.
Built on confidential production data; visuals are representative of the reporting style.