Center of Excellence Reporting Suite
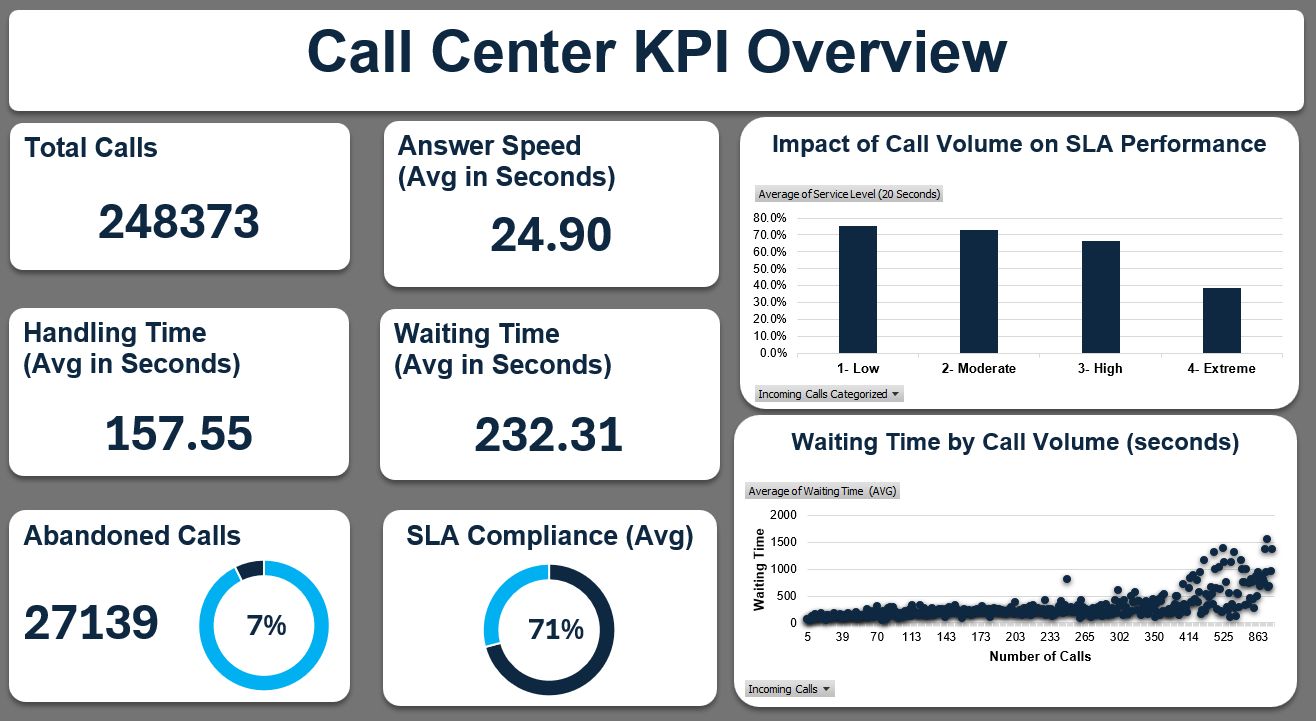
Multi-tab Excel suite — the account's single source of truth for audit, coaching, quality, and compliance — used weekly by QA and operations leaders.
A curated tour of dashboards, analytics workflows, and automation scripts that translate raw data into direction — from a production reporting suite to interactive BI stories.
Dedicated pages dive deeper into each discipline, with project breakdowns, visuals, and learning notes.
Interactive dashboards that surface insight for product, marketing, and operations.
Business intelligence with DAX, data modeling, and stakeholder-ready UX.
Production reporting suites, automation, and KPI monitoring for fast decisions.
Analytical notebooks, data cleaning, and automation scripts.
CTEs, reusable views, and reporting for relational databases.
Data collection pipelines that keep insights fresh with automated updates.
Each project pairs robust analysis with clear storytelling and measurable outcomes. Filter by the tool you care about.
Multi-tab Excel suite — the account's single source of truth for audit, coaching, quality, and compliance — used weekly by QA and operations leaders.
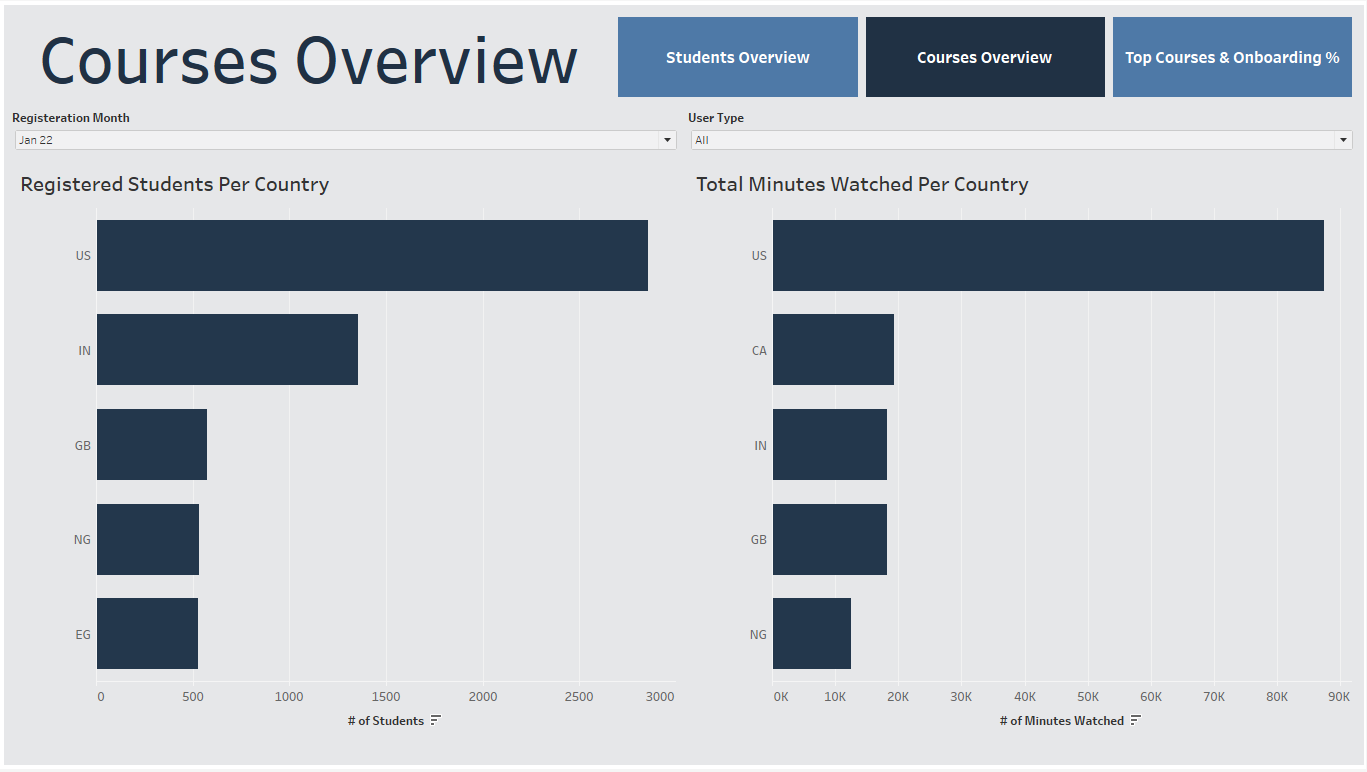
SQL pipelines over 35,000+ students, visualized in Tableau to guide marketing, pricing, and localization strategy.
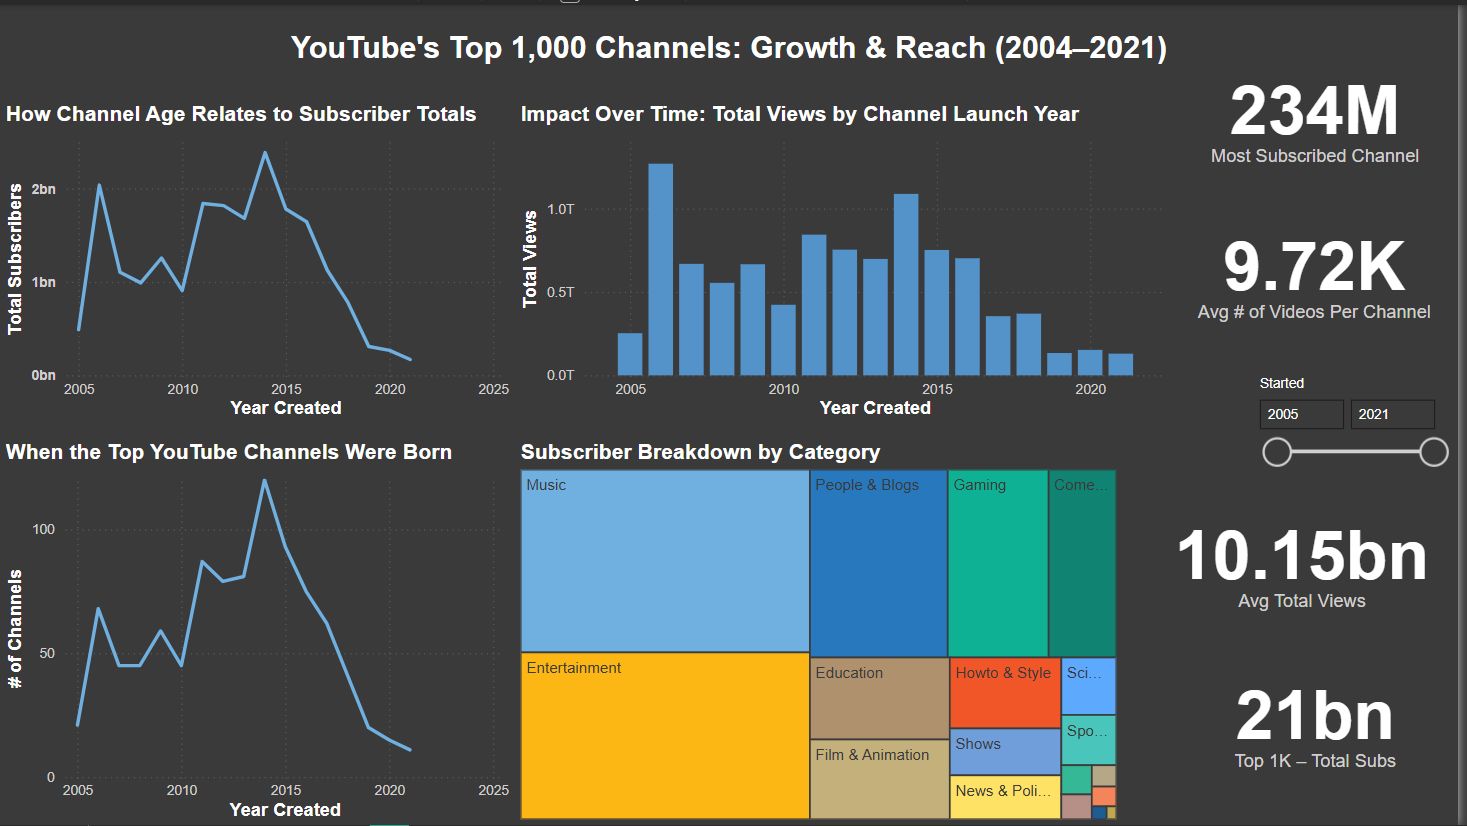
Interactive Power BI dashboard profiling algorithm trends, retention, and globalization from 2004 to 2021.
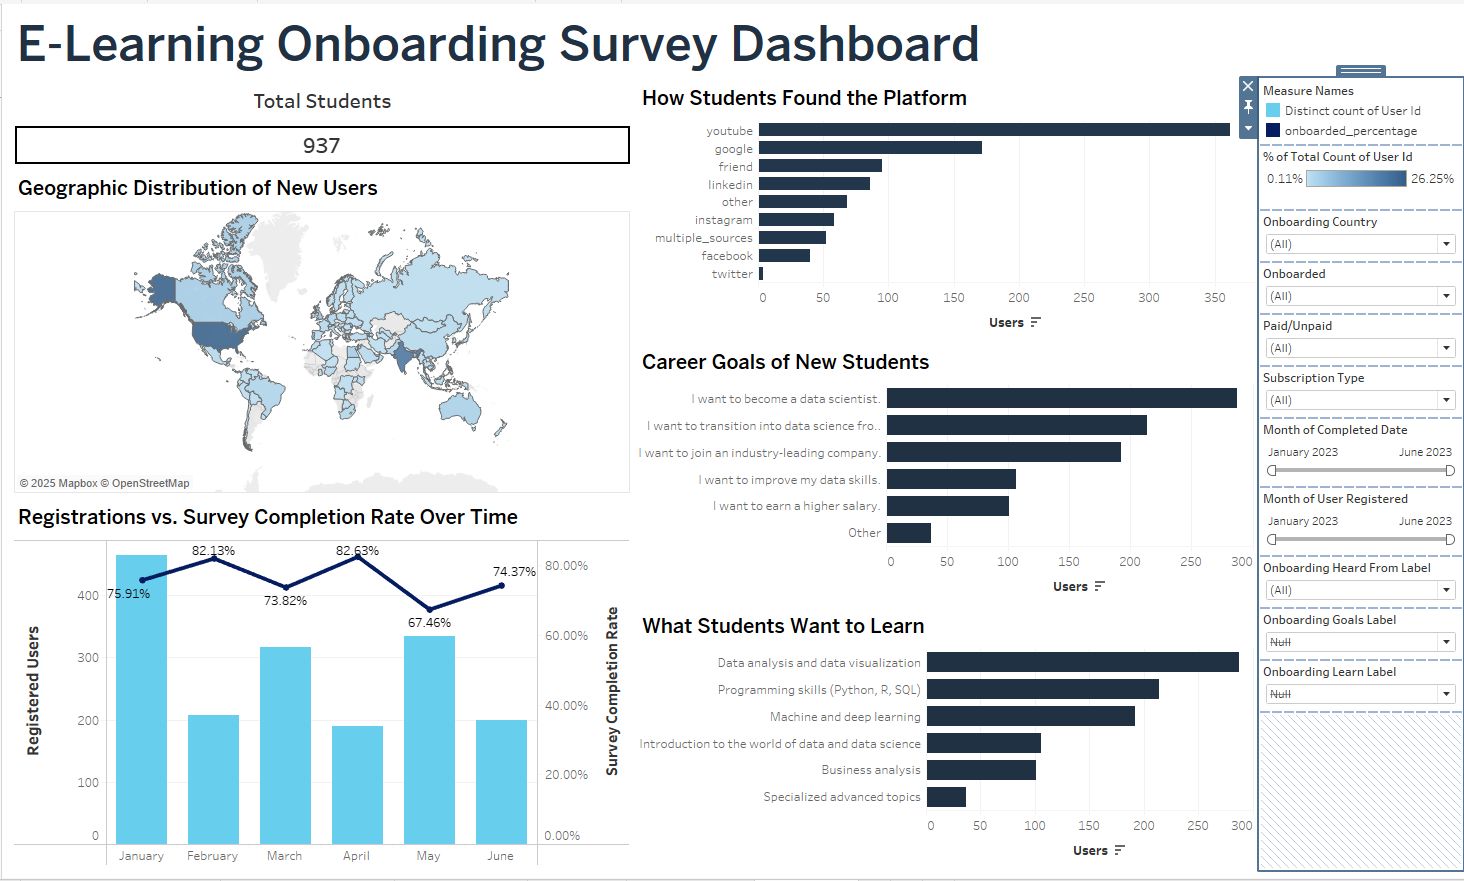
Interactive Tableau experience tracking how learners discover, join, and prioritize courses on a data-science platform.
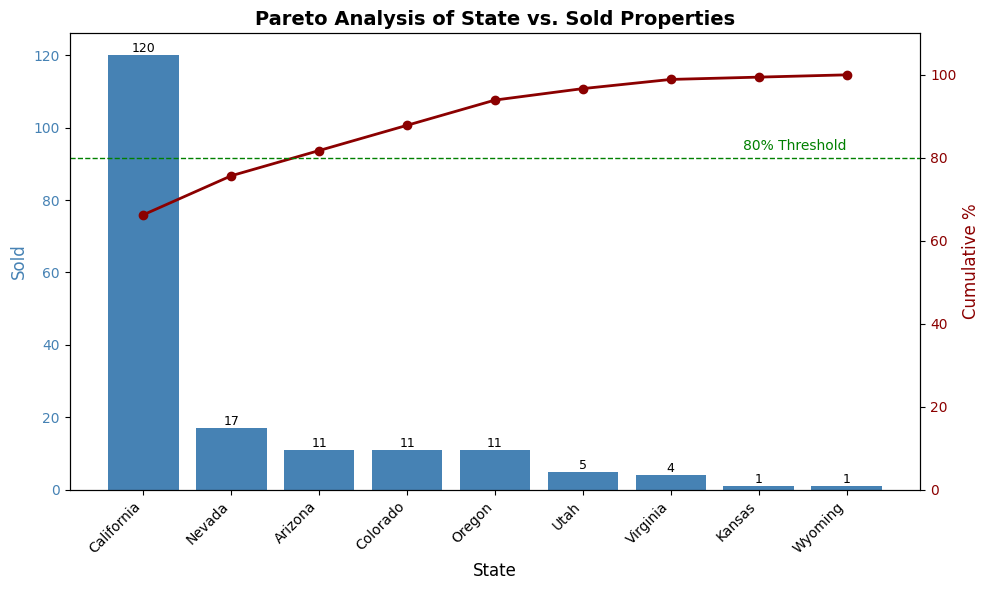
Python workflow merging property sales with customer profiles to reveal demand, personas, and revenue trends.
Scheduled scraper that logs product titles, prices, and dates to build a historical price dataset.