Power BI portfolio
Business intelligence that scales with curiosity
Translating raw data into interactive Power BI stories that highlight momentum, patterns, and opportunity.
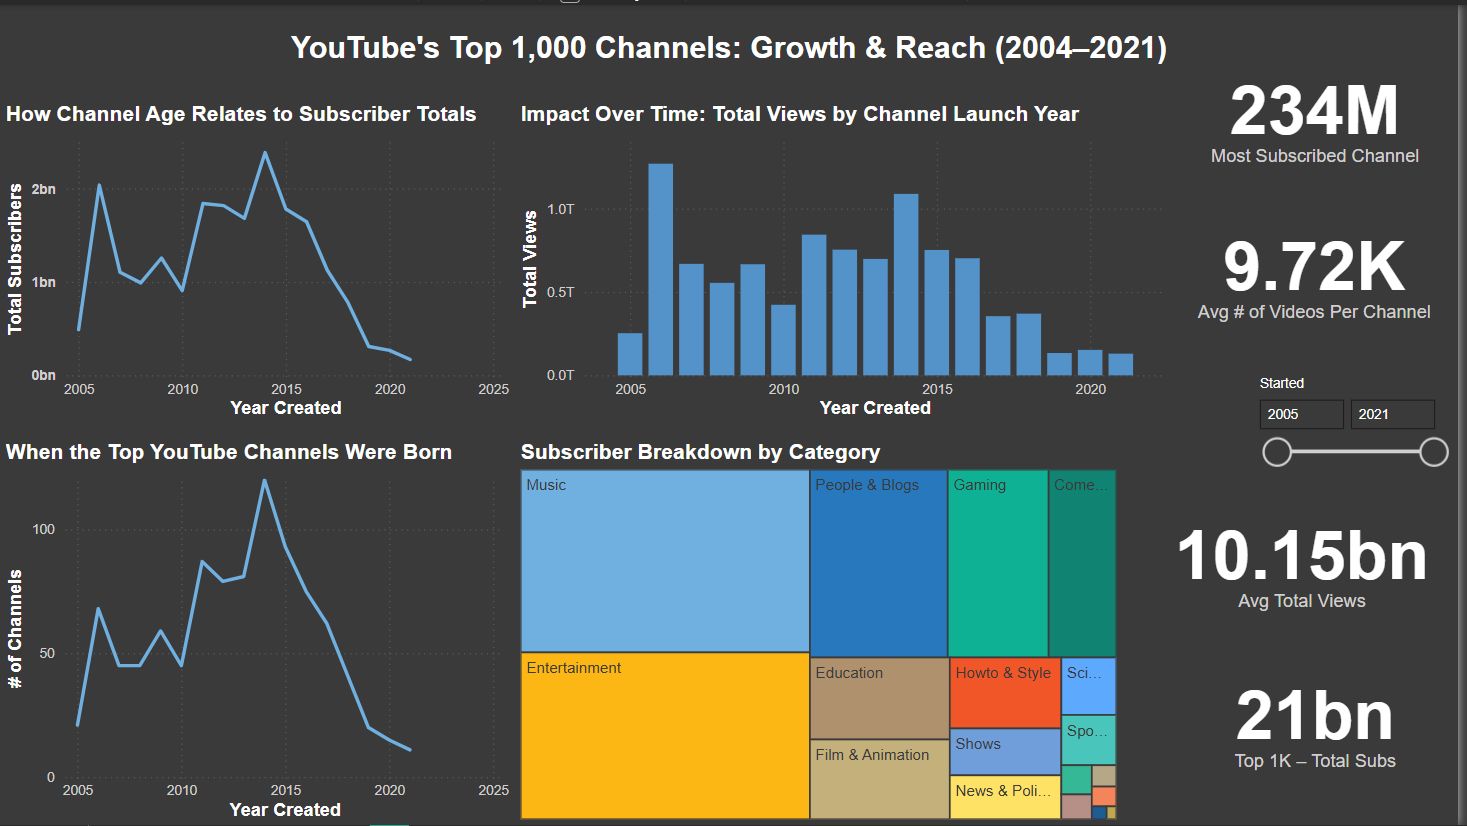
YouTube's Top 1,000 Channels
Interactive dashboard tracking the evolution of YouTube's leading creators between 2004 and 2021, revealing how algorithm shifts and global adoption reshaped growth.
Focus: Understand what drove the 2014 breakout year and longevity.
Key insights
- Algorithm changes in 2012–2013 prioritized watch time, amplifying long-form content.
- Mobile access accelerated global growth — especially across India, Brazil, and Europe.
- Early adopters who evolved formats kept dominance, while 2014 newcomers seized explosive growth.