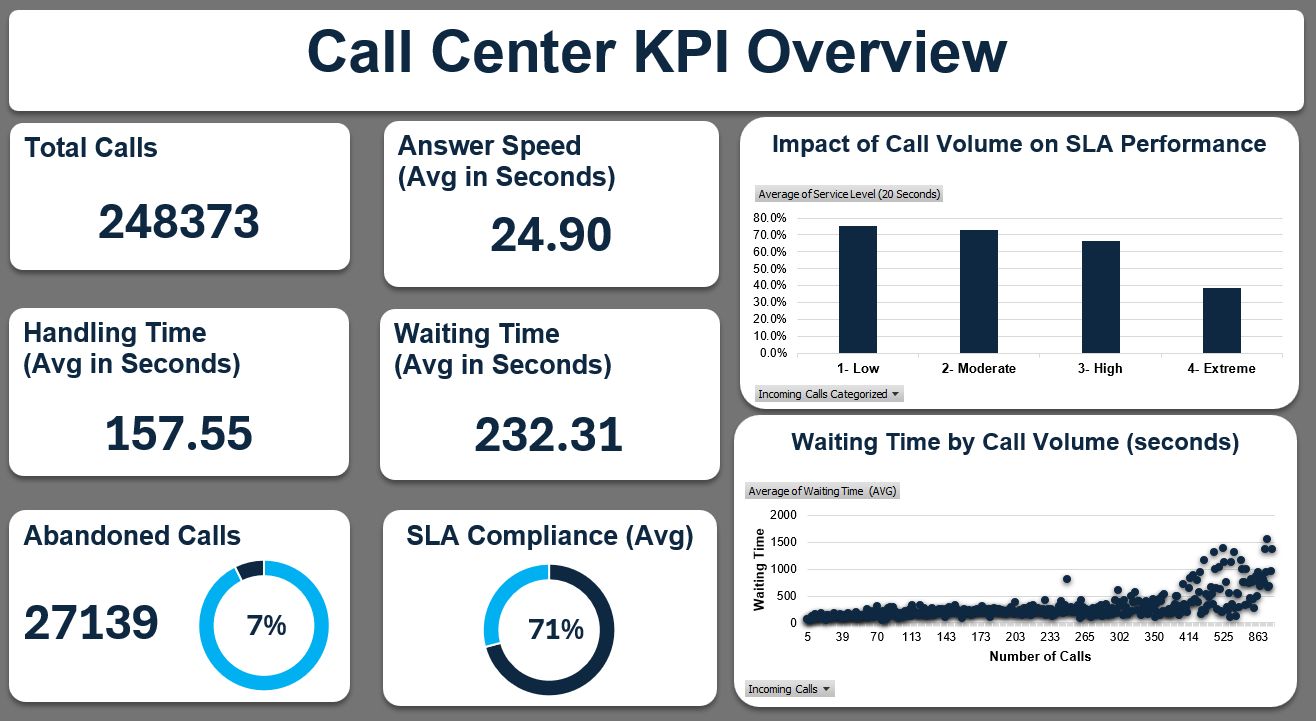
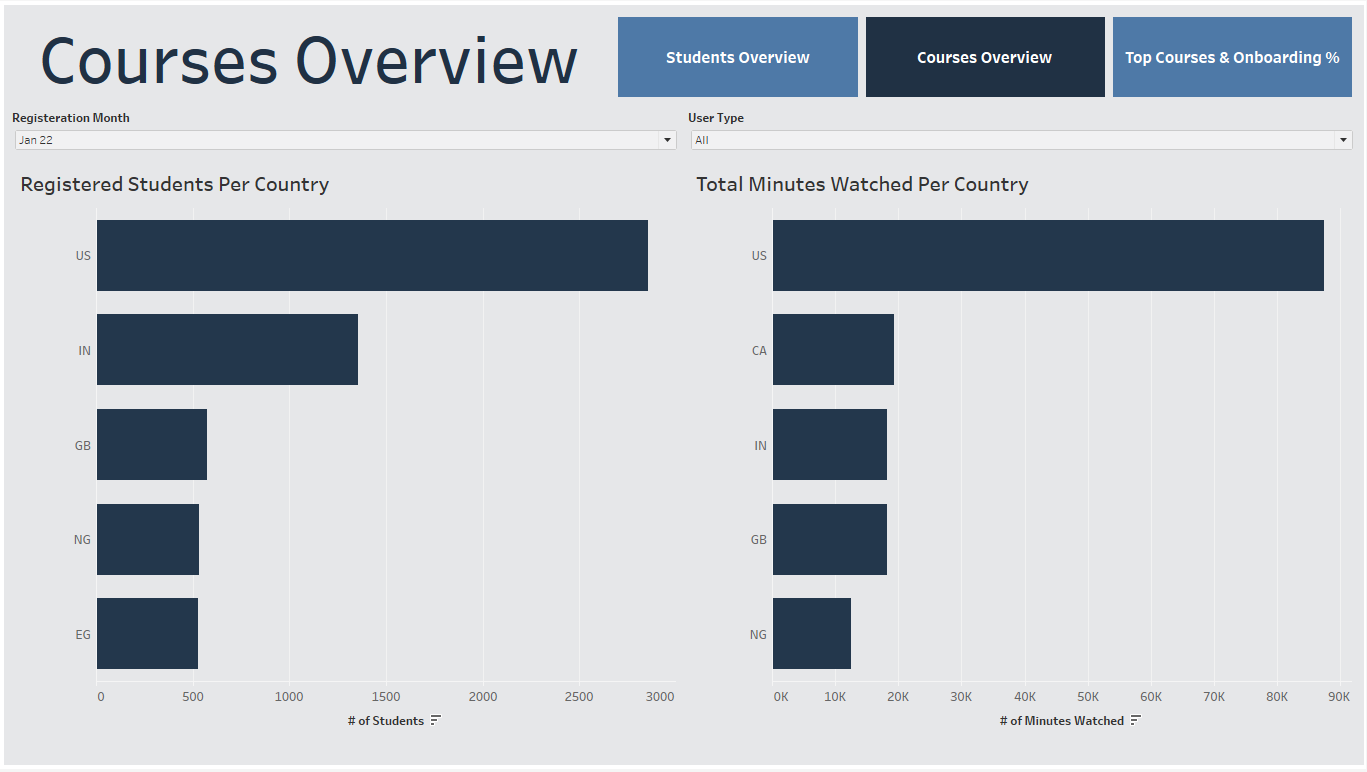
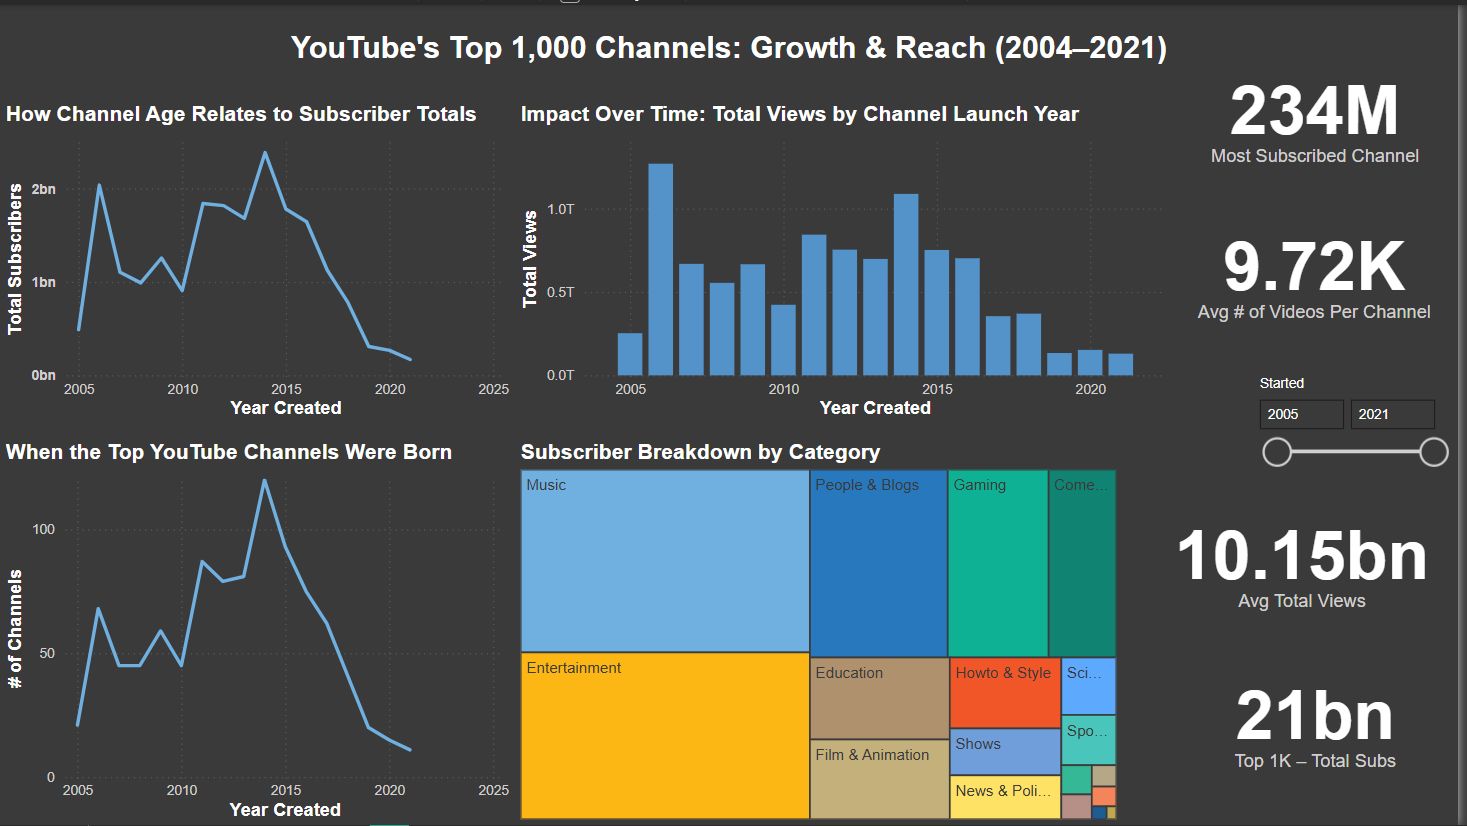
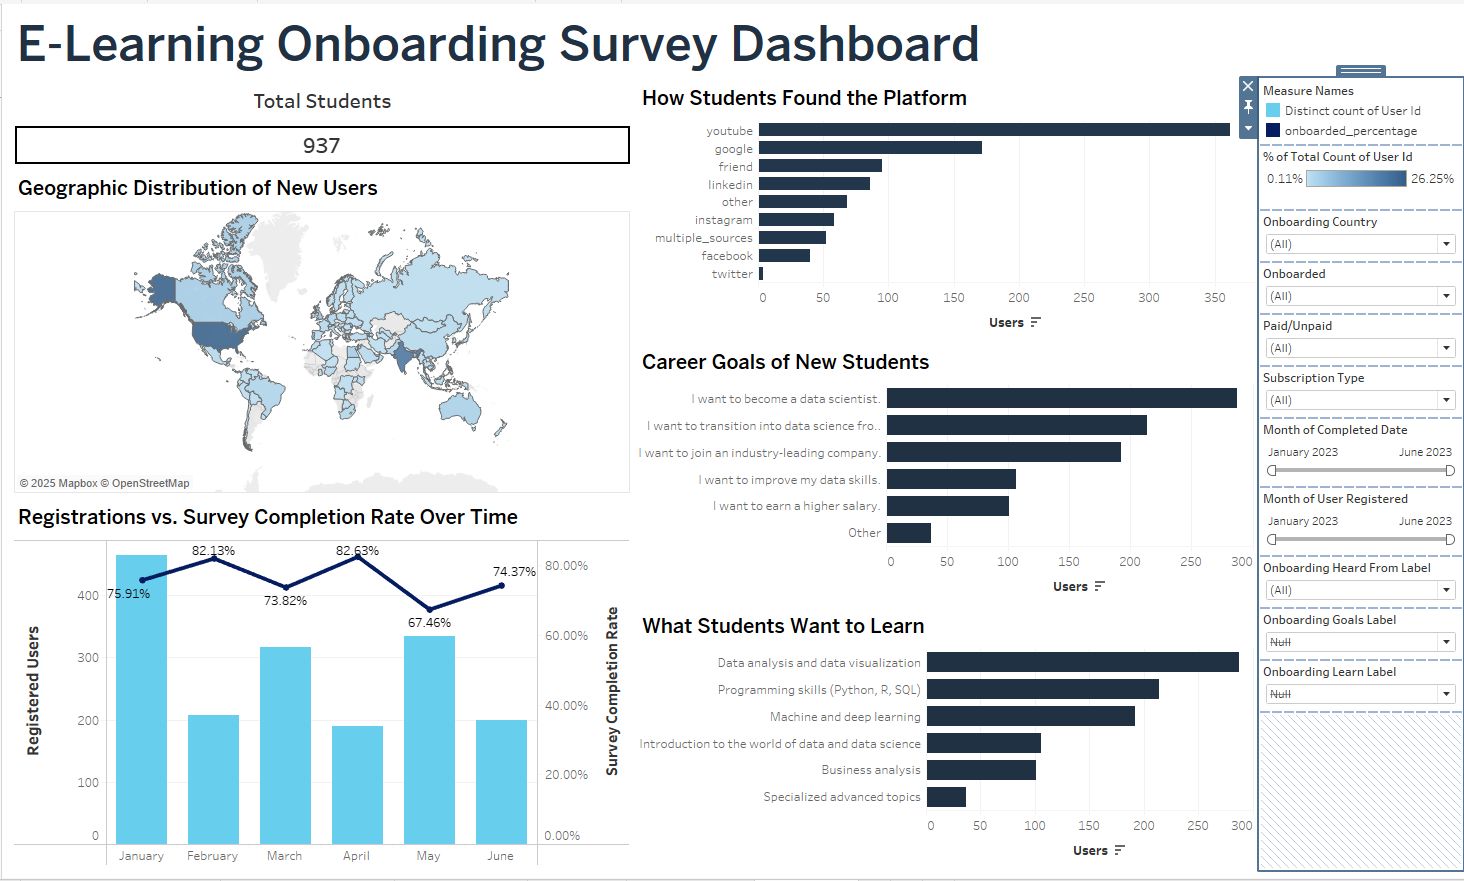
Data visualization
Build dashboards that bring clarity to growth, operations, and customer journeys.
- Advanced Tableau and Power BI stories with interactive drilldowns.
- Excel solutions with Pivot Tables, Macros, and Power Query for rapid insight.
- Python-based visuals with Matplotlib, Seaborn, and Plotly.
Programming & analysis
Design resilient data workflows that blend automation with human-ready narratives.
- Python (pandas, NumPy, scikit-learn) for cleaning, modeling, and ML.
- SQL development with PostgreSQL and MySQL for analytics and reporting.
- R packages including ggplot2, dplyr, and tidyr for statistical exploration.
Statistical methods
Validate ideas with rigorous quantitative techniques that drive confident decisions.
- Hypothesis and A/B testing to evaluate product and service changes.
- Regression analysis for forecasting and performance measurement.
- Descriptive and inferential statistics to highlight actionable signals.